PreScreen
What is it?
PreScreen is a multivariate statistical data pre-screening toolbox designed to greatly simplify and speed up the initial data cleaning tasks. PreScreen was originally designed for process engineers who wish to pre-process and pre-screen large industrial process datasets prior to multivariate data analysis, process data modelling, or building predictive and inferential models. The software is also applicable to other large analytical data sets such as chromatographic data. The software includes a powerful user interface that provides a user-friendly mouse/menu driven access to the data analysis tools.
The latest version includes the following features:
- Data tags
- Normality (univariate and multivariate)
- Summary statistics (mean, standard deviations, covariance, correlations, skewness and kurtosis)
- Missing data analysis and rectification
- Spurious (outlier) data elimination
- Data transformations
- Data filtering
- Cross correlation
- Data transformations (mathematical and time shifting)
- Scatter plots
- Loadings and contribution plots
- Histogram plots
- Normal probability plots
- Action tracking
Who should use it?
- Process engineers
- Anybody needing to pre-screen or generate models from large analytical data sets
Benefits:
- Easy to use interface
- Much faster data pre-screening and pre-cleaning, potentially saving 75 % of total modelling time
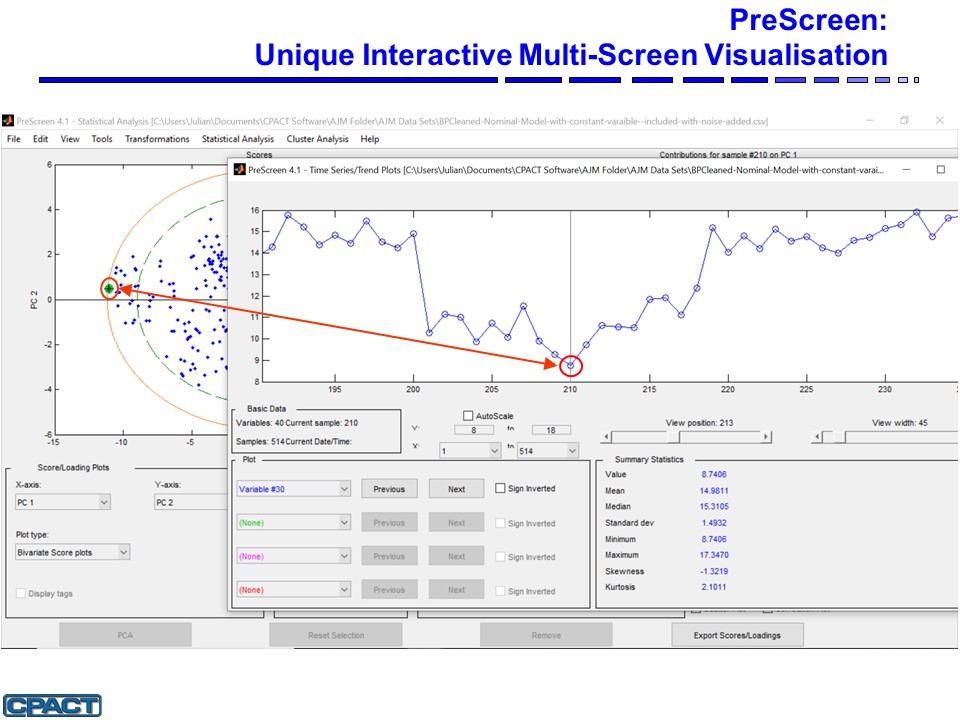
PreScreen helps identify outliers in time series plots